Screenshots
Interactive configuration window
Interactive screenshot of SSC Serv's configuration window. You can click on other tabs to see the
configuration of plug-ins. More details on specific options are available below.
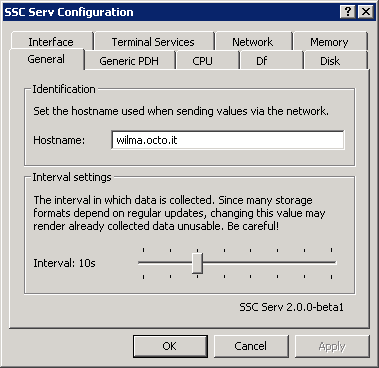
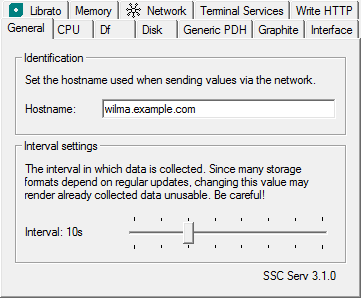
General configuration
In the main window of SSC Serv's configuration you can set the hostname which this instance should use and the interval, at which data is collected. Changing these basic settings after some data has been collected is not recommended.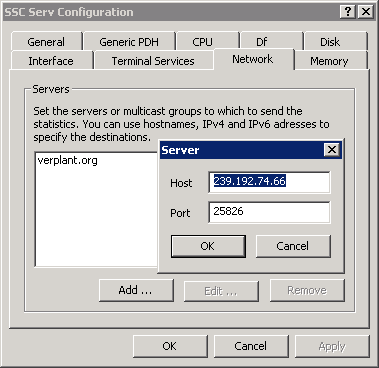
Network configuration
The network configuration window allows you to configure one or more collectd servers to which to send the collected etrics. It allows to configure multiple destination addresses easily using the “Add …”, “Edit …” and “Remove” buttons. Both, IPv4 and IPv6 are supported transparently, as well as multicast addresses.
Ignorelist functionality
You're not interested in traffic over the loopback interface and free space on a network drive? No problem! You probably know “ignorelists” from collectd. The same functionality is present in the Df, Disk and Interface (pictured) plugins of SSC Serv. Just select the appropriate items and select whether to only collect the selected items and ignore everything else (“Collect”), or ignore the selected items and collect everything else (“Ignore”).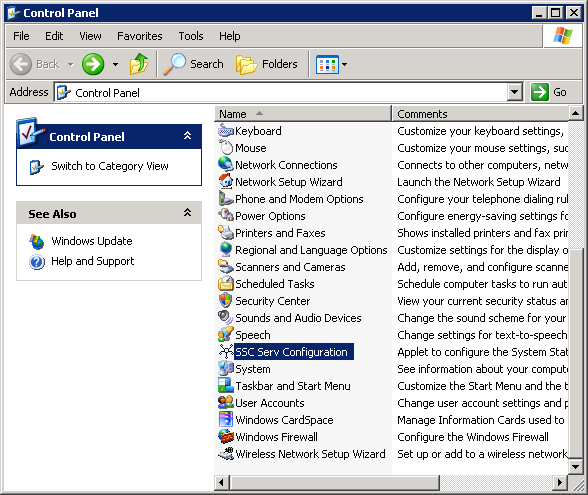
Control Panel integration
SSC Serv's configuration applet is fully integrated into the Control Panel. No annoying shortcut is bloating your start menu or filling up your desktop. Yet, you don't have to dig through the filesystem to find that hidden setup utility. It's exactly where it's supposed to be.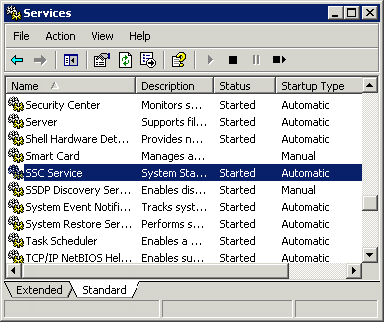
Nice and quiet
It is not SSC Serv's purpose to make a big fuss about it's existence. It's supposed to just be there when you need it and shut up in the meantime. As a service, you won't notice that SSC Serv is working in the background. If you want to know if it's running at all, or if you want to configure if the service should be started at system start, go to the "Services" window in "Administrative Tasks".Generic and powerful
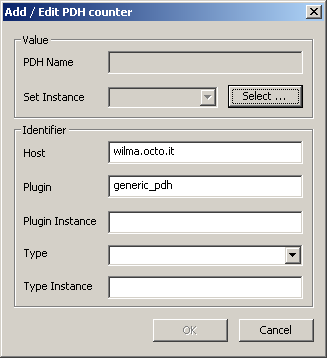
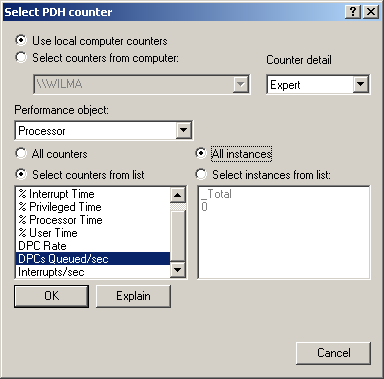
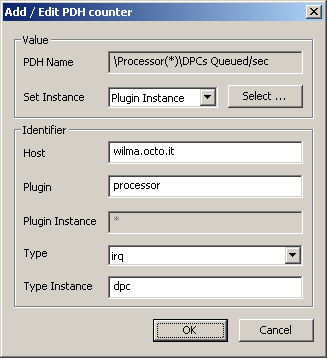
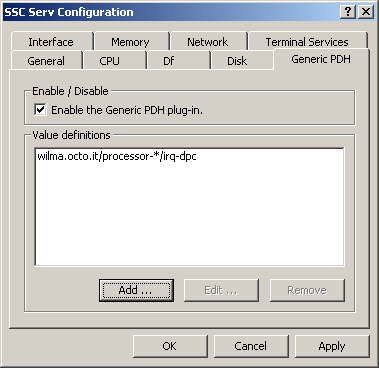
Using the generic and powerful Generic PDH plugin, you can query any information made available via the Performance Data Handles (PDH). Using this plugin requires good knowledge of collectd's naming schema, especially the “types.” But once you made yourself comfortable with this generic approach, you'll have a very powerful tool to select statistics about esoteric system metrics, other applications and even in-house developments.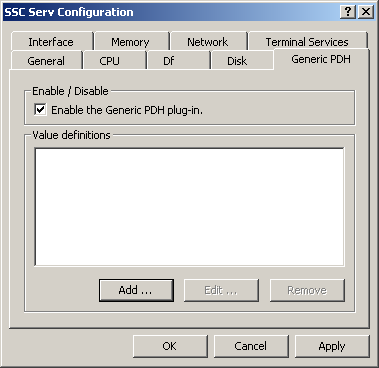 |
 |
 |
 |
 |